
The 8-Minute Delay Problem: Why Aircraft Turnaround Is a Dependency Problem
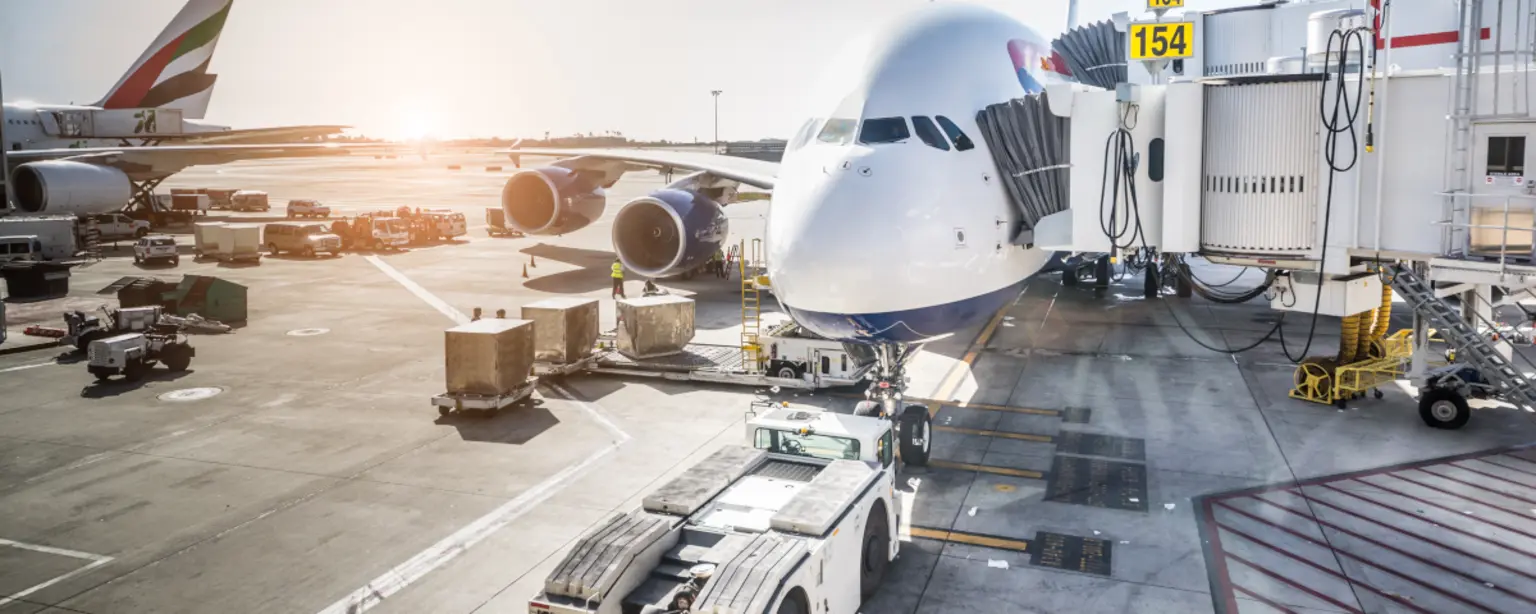
A flight has a 35-minute scheduled turnaround.
One activity starts 8 minutes late.
Does that automatically mean the aircraft will depart 8 minutes late?
Not necessarily.
This is one of the interesting things about analysing aircraft turnaround: the impact of a delay depends not only on how many minutes were lost, but also on where those minutes were lost and what depended on that activity.
A turnaround is more than a checklist
From the outside, an aircraft turnaround can look like a sequence of individual tasks:
Passengers disembark
Baggage is unloaded
Cleaning is completed
Fuel is uplifted
Catering and other servicing are performed
Baggage is loaded
Passengers board
Final checks are completed
The aircraft departs
But these activities do not operate in isolation.
Some can happen in parallel. Some depend on other activities. Some have buffers. Others can become a direct constraint on departure.
That makes the following question more useful than simply asking:
“Which activity was delayed?”
The better question is:
“Which delayed activity actually constrained the departure?”
The difference between delay and impact
Imagine a turnaround where the scheduled departure is 10:35.
Baggage loading is expected to finish at 10:25 but actually finishes at 10:31.
That is a 6-minute deviation.
But suppose boarding and the remaining departure processes still finish in time for the aircraft to leave at 10:35.
The baggage process was late.
The flight wasn't necessarily late.
Now consider another scenario where baggage loading must finish before a final process can begin. The same 6-minute deviation could now move the entire chain and result in a 6-minute departure delay.
The number is the same.
The operational impact is different.
This is why I find it useful to think of turnaround performance as a dependency problem, rather than simply a time problem.
Small delays can become bigger delays
There is another layer that makes aviation operations particularly interesting: reactionary delay.
An aircraft that departs late from one station may arrive late at the next station.
That reduces the available turnaround window for its next flight.
If the next turnaround cannot absorb the lost time, the aircraft departs late again.
And the cycle can continue.
Late arrival → reduced turnaround window → late departure → late arrival at the next station → another reduced turnaround window
EUROCONTROL's 2024 analysis found that reactionary, or knock-on, delay accounted for 46% of total delay minutes in European aviation, averaging 8.0 minutes per flight.
So a delay should not always be viewed as an isolated event.
Sometimes the real problem is what that delay causes next.
This is where analytics becomes interesting
When you start looking at operational data, one thing becomes clear: the final delay figure rarely tells the whole story.
Instead, imagine having timestamps for individual turnaround activities.
You could ask:
Which activities consistently run late?
Which activities have the greatest impact on departure?
Which activities are most variable?
How much buffer exists between activities?
Is the delay primary or reactionary?
These questions move analysis from:
“The flight was delayed by 8 minutes.”
to:
“What happened during the turnaround, what constrained the operation, and what could have prevented the delay from propagating?”
That is a much more useful operational question.
Averages don't tell the whole story
Another area where analytics can help is understanding variability.
Suppose two operations both have an average turnaround time of 40 minutes.
Operation A usually completes between 38 and 42 minutes.
Operation B can take anywhere from 32 to 52 minutes.
Their averages are identical.
Their operational risk is not.
This is why percentile analysis can be useful.
Instead of looking only at the average or median, an operations team could examine measures such as the 65th, 80th or 95th percentile to understand how the process behaves under less typical conditions.
That information can help with planning buffers, identifying unstable processes and deciding where additional operational attention may have the greatest benefit.
The goal isn't always a faster turnaround
There is an important distinction here.
Making every turnaround as short as possible is not necessarily the objective.
Making turnaround performance predictable, safe and consistently achievable may be more valuable.
That changes the way we should think about optimisation.
Instead of asking:
“How can we save two minutes?”
we could ask:
“How can we reduce the probability that a small disruption becomes a departure delay?”
That is where operational analytics can have real value.
From delay reporting to delay prevention
A traditional delay report tells us what happened.
A good analytical system should help us understand why it happened, how it propagated, and where intervention could have made a difference.
With structured turnaround timestamps, delay codes, flight rotations and historical operational data, it becomes possible to study those relationships rather than treating every delay as an isolated number.
The future isn't just about reporting that an aircraft was late.
It is about understanding where the operation started drifting, whether the drift could be absorbed, and what prevented recovery.
That, to me, is one of the most interesting opportunities in aviation analytics.
What do you think?
For improving OTP, which would have a bigger impact?
A. Reducing the average turnaround time
or
B. Reducing turnaround variability and preventing delay propagation?
I'd be interested to hear how people working in airline operations, ground handling and airport analytics look at this differently.